Over the first half of the year, global equity returns have been dominated by the returns of these seven companies: Apple, Microsoft, Amazon, Alphabet (Google), Meta (Facebook), Nvidia and Tesla. These are all mega-cap growth shares in the US which, given their extreme size, together make up more than 27% of the S&P 500 (as of 30 June 2023).
These seven businesses have benefitted this year both from a bounce back from their big falls last year, as well as the recent breakthroughs in artificial intelligence as most are perceived to be beneficiaries. Nvidia, for example, makes the chips used to power AI servers whilst the others, bar Tesla, all have significant software/data products which would likely benefit to some extent.
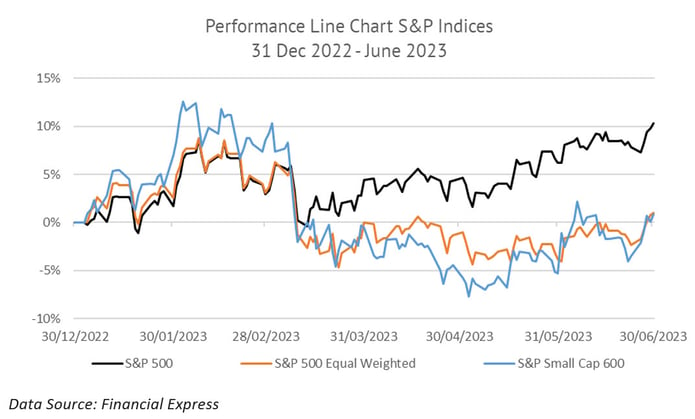
One way to see just how much these stocks have dominated returns this year is to look at the S&P 500 index, a market cap weighted index and hence heavily skewed towards these mega-caps, and compare it to an equal weighted version of the same index (i.e. where each member is ascribed a 0.2% weight). As these seven companies make up more than 27% of S&P 500, but only 1.4% of the equal weighted version, any outperformance of these names shows up quite clearly in the difference between these two indices. And indeed, the S&P 500 is up over 10% in pound sterling terms over the first half of 2023, whilst the equal weighted S&P 500 is only up just over 1%.
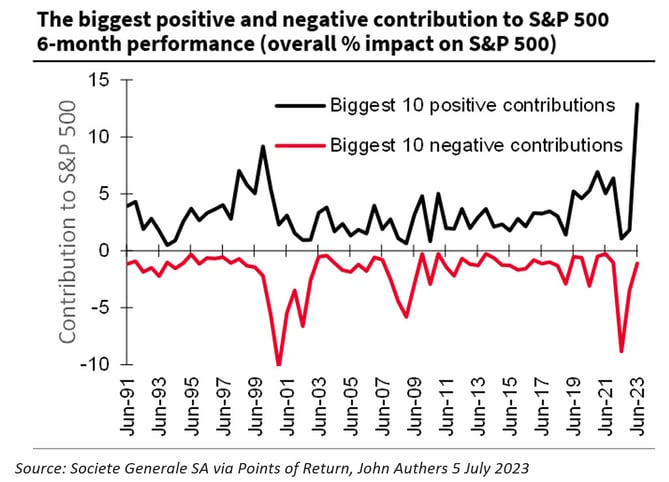
This concentration of performance is extreme, bigger even than that during the TMT bubble, as the below chart from Societe Generale shows:
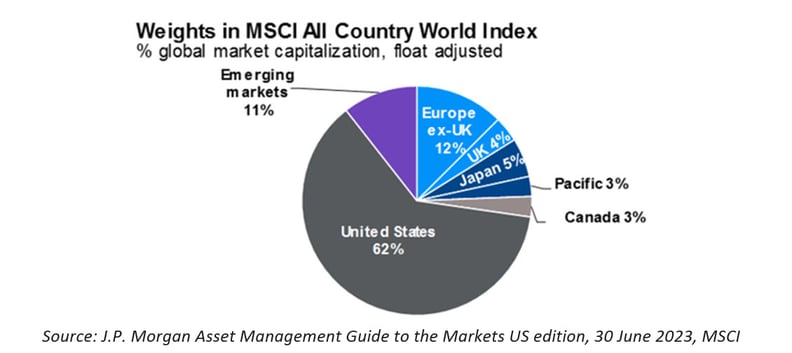
This narrow driver of performance is also symptomatic of a wider concentration issue in equities. At the macro level, global equities are heavily skewed towards those listed in the US, with 62% of global indices such as the MSCI All Country Index being comprised of US equities.
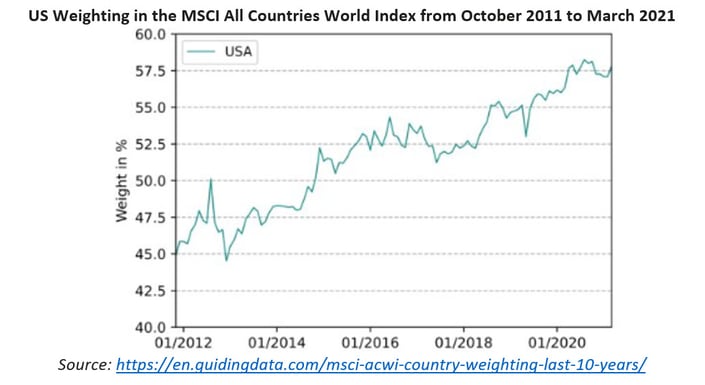
Now, this has not always been the case – 10 years ago, US equities made up less than 50% of the global benchmark. The US has increased as a proportion of the total for two reasons: stock outperformance vs other regions but also outperformance of US stock exchanges in terms of attracting new listings (undoubtedly a side effect of historical outperformance).
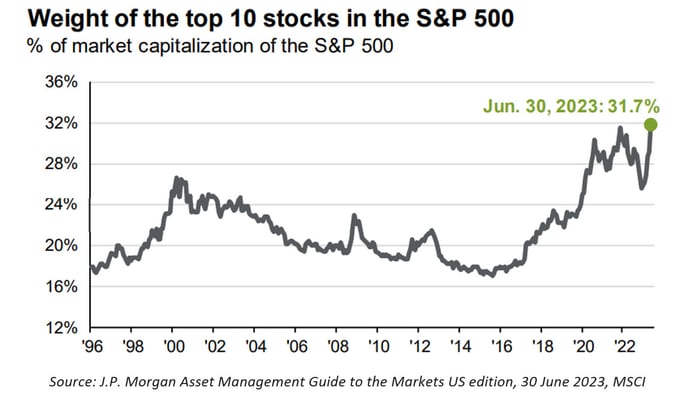
However, it’s not just the US as a proportion of global equities that has been getting bigger, it’s also the companies within the US market that have been getting bigger. The weighting of the top 10 stocks (the seven companies plus Berkshire Hathaway, United Healthcare and Exxon Mobil) within the large cap US S&P 500 index has been rising steadily and now stands at a remarkable 31.7% of the total market cap.
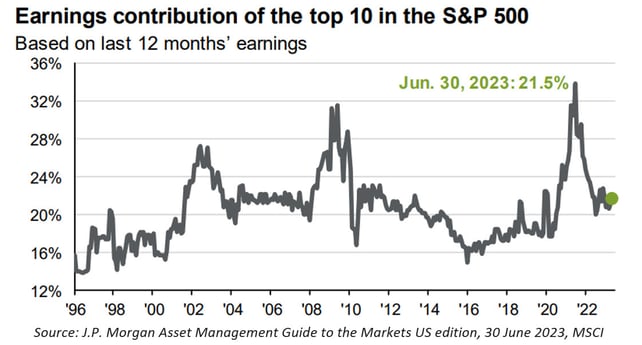
Now, this concentration would be less of an issue if ‘the big getting bigger’ were due solely to outperformance of the top 10’s fundamentals such as earnings and cash flows. This hasn’t, however, been the case. Currently, these top 10 only make up 21.5% of total S&P 500 earnings, a level a long way below their 32% market cap weighting.
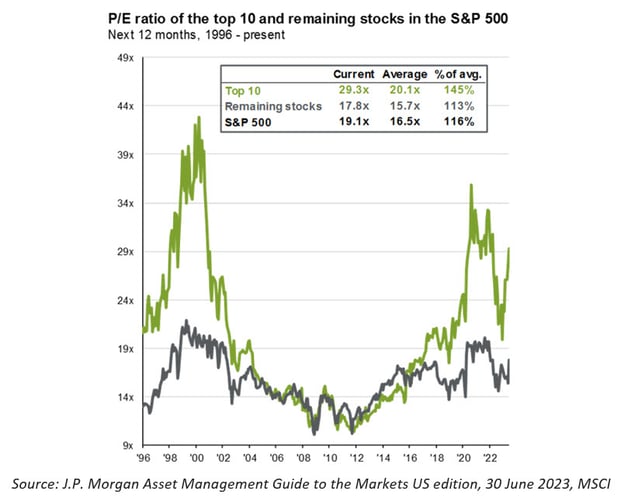
Also, if you look at valuations, a big part of the growth of the top 10’s market cap has been due to multiple expansion rather than earnings growth, indicating that the top 10 are now very expensive:
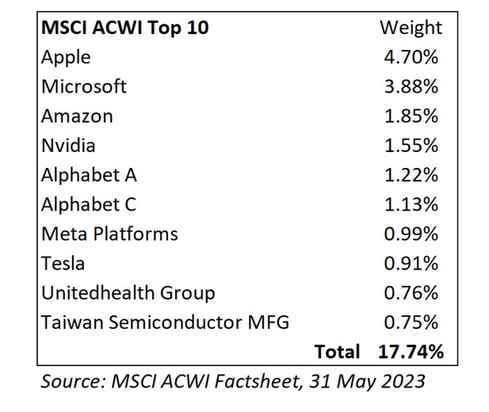
Overall, what does this mean? Equity markets have been getting more concentrated over the last decade as the winners have kept winning. There are over 9,000 stocks to choose from when investing in global equities, but the top 10 (which includes the seven companies mentioned before) make up almost 18% of the total weighting (using the MSCI All Country World Index):
And as we’ve seen, a big part of the outperformance of the top 10 has been due to those winners getting more and more expensive.
Historically, no group of mega-caps has ever remained in the global equity top 10 over multiple decades. In 1980 it was oil companies that dominated the top 10, in the 1990s it was Japanese companies, in 2000 it was the TMT companies of the internet boom and in 2010 it was Chinese and commodity companies off the back of the commodity ‘super-cycle’.
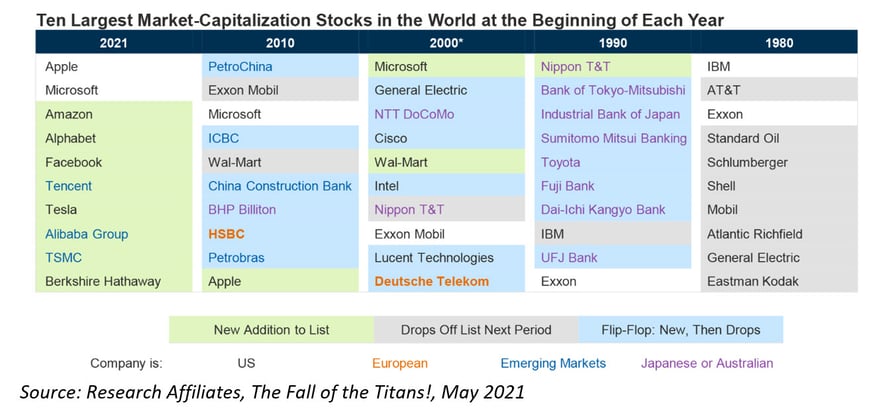
The valuations of the top 10 at the time have always reasserted themselves as they fall out of favour and were replaced by the next generation of mega-caps amongst the other 9,000+ global equities out there. We don’t think this time will be different.
The market may think that past winners are sexy, but we think that investors should be far more focused on trying to own more of the future winners instead.
About Us
PortfolioMetrix is a global investment manager operating in the United Kingdom, South Africa, and Ireland. We support independent advisers to scale sustainably without compromising the quality of advice they provide to their clients.
Our risk-based investment process ensures carefully calibrated portfolios that deliver predictable outcomes specific to each investor. See how we partner with advisers.
Our technology, WealthExplorer™ allows the adviser to extract the synergies between financial advice and investment management, providing deeper client insights and more robust recommendations.
For more information, send us an email at engagement@portfoliometrix.co.uk
PortfolioMetrix cannot accept any liability for loss for doing so. The value of investments, and the income from them, can go down as well as up, and you may not recover the amount of your original investment. Past performance is not a reliable indicator of future performance. Portfolio holdings and asset allocation can change at any time without notice. PortfolioMetrix Asset Management Ltd is authorised and regulated by the Financial Conduct Authority.